

Risk
CPE Week | Join us for our second annual CPE Feast, November 30 to December 3 | Register here about this announcement
November 17, 2026 • 14 min read
Boards and regulators are asking security teams a question that a color-coded rating cannot answer: What is this risk worth in dollars?
A red square on a heat map says something is bad, but it doesn’t say what it would cost, how often it is likely, or whether the proposed control spend is proportional.
Quantification answers it by expressing exposure as a range of probable loss instead of a label, and a framework is what makes that estimate repeatable. FAIR is the one most teams reach for, but it’s also the most misdescribed, starting with its conflation with Open FAIR, a separate publication from a different standards body.
This guide covers what a cyber risk quantification framework is, how FAIR structures one, where FAIR and Open FAIR differ, and how to run a first analysis narrow enough to finish: one asset, one loss scenario, and assumptions you can defend.
A cyber risk quantification framework is a structured method for estimating how often a loss event is likely to occur and what it would cost, expressed as a range of probable financial loss instead of a qualitative label. It defines the factors that make up risk, how they combine, and what has to be documented about the inputs behind them.
The framework is the methodology; the software that executes it is a separate decision, and cyber risk quantification tools cover that question.
What separates the three is what you can do with the output. Qualitative assessment assigns descriptive labels: high, medium, low. Semi-quantitative assessment maps those labels onto numeric bins, sortable but not additive.
Quantitative assessment expresses risk in units that can be aggregated, compared, and set against a budget (the only approach that supports a cost-benefit argument).
A risk register records that a risk exists, who owns it, and what rating it carries, not how often the loss event is expected or what it would cost. A framework supplies that structure: Two analysts working the same scenario reach comparable numbers.
Three forces are converging on security leaders: executive leadership demanding quantifiable cyber risk data, intensified board and regulatory scrutiny, and cybersecurity budgets assessed in financial terms like every other capital request.
An IT risk manager can produce a rating of high. Producing the number a CFO needs to weigh that risk against every other claim on the same budget is a different exercise, and the rating does not get them there.
Directors are not asking whether a risk is red, but what the organization is exposed to, what reducing that exposure costs, and whether the trade is worth making. Quantified output gives a board something it can weigh against other commitments competing for the same money.
A control proposal reads differently when it carries an expected loss reduction rather than a severity label: the range of loss now, the range after the control, and the cost of closing the gap.
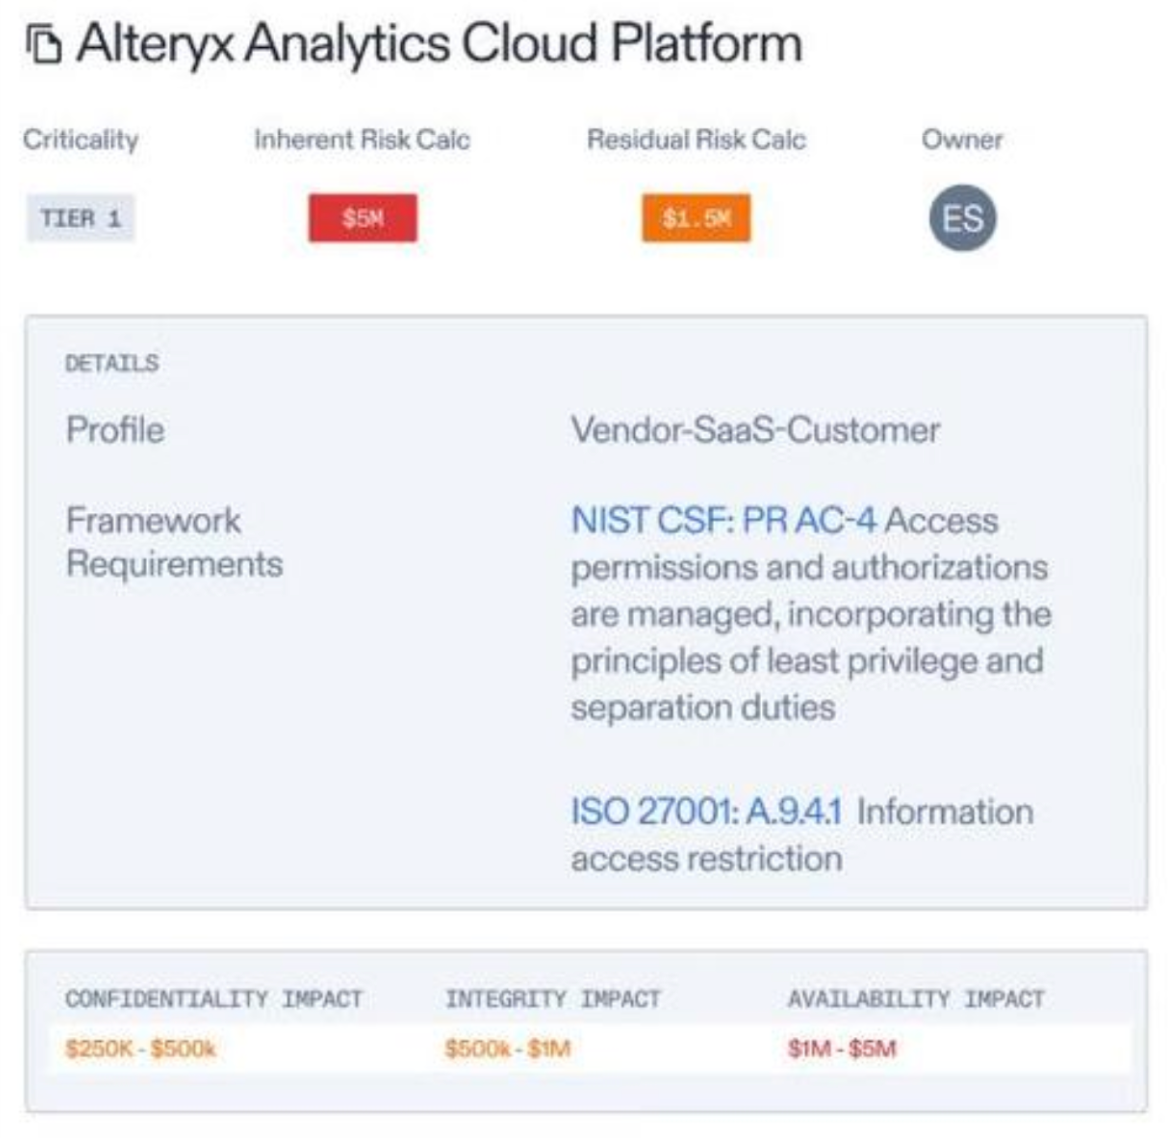
Teams without the data or analyst time solve for capacity first, which is the subject of overcoming resource barriers to risk quantification.
FAIR (Factor Analysis of Information Risk) is the quantification methodology most often referenced in cyber risk. The FAIR Model Standard Artifact v3.0, published by the FAIR Institute on January 15, 2025, defines risk as "the probable frequency and probable magnitude of future loss."
Everything in the model rests on two top-level factors: Loss Event Frequency (LEF), or how often a loss event is expected, and Loss Magnitude (LM), or how much loss it produces.
Factor | Sits under | What it estimates |
|---|---|---|
Loss Event Frequency (LEF) | Risk | How often a loss event occurs in a given period |
Threat Event Frequency (TEF) | Loss Event Frequency | How often a threat actor acts against the asset |
Contact Frequency (CF) | Threat Event Frequency | How often the actor comes into contact with the asset |
Probability of Action (PoA) | Threat Event Frequency | How often that contact becomes an attempt |
Susceptibility (Susc) | Loss Event Frequency | How often an attempt becomes a loss event |
Threat Capability (TCap) | Susceptibility | The capability of the threat actor |
Resistance Strength (RS) | Susceptibility | The strength of the controls resisting that actor |
Loss Magnitude (LM) | Risk | How much loss a single event produces |
Primary Loss (PL) | Loss Magnitude | Loss falling directly on the organization |
Secondary Loss (SL) | Loss Magnitude | Loss arising from secondary stakeholder reactions |
Secondary Loss Event Frequency (SLEF) | Secondary Loss | How often secondary stakeholders react |
Secondary Loss Magnitude (SLM) | Secondary Loss | How much that reaction costs |
Decomposition is what makes the method workable. Contact frequency, probability of action, and resistance strength are questions a security team can answer from its own telemetry, incident history, and control testing.
The FAIR Model Standard Artifact is published by the FAIR Institute. Open FAIR is published by The Open Group as two standards: O-RT, the Open Risk Taxonomy Standard, and O-RA, the Open Risk Analysis Standard.
The Open Group's own Open FAIR certification material describes Open FAIR as "a risk analysis methodology." The distinction matters when evaluating training, certification, or consulting support.
NIST SP 800-30 Rev. 1 (September 2012) accommodates all three approaches, "including quantitatively, qualitatively, or semi-quantitatively." FAIR is complementary rather than competing: the analytical layer NIST allows for when the approach is quantitative.
A model produces a number regardless of what you feed it. Three components do most of the work, and each depends on asset data, control data, and the risk register being connected rather than held in separate spreadsheets.
Optro (formerly AuditBoard) builds its IT & cyber risk management software on that connection, mapping risks to frameworks, controls, and policies so cyber risk and compliance can be read together rather than reconciled.
An estimate then draws on a single source of risk instead of three disconnected systems.
Quantification starts with knowing which assets are worth modeling. An inventory recording data classification, criticality, and asset type turns scenario selection from an argument into a query.
With Optro, criticality and ownership are recorded against every asset and risk, and CMDB integrations keep them current.
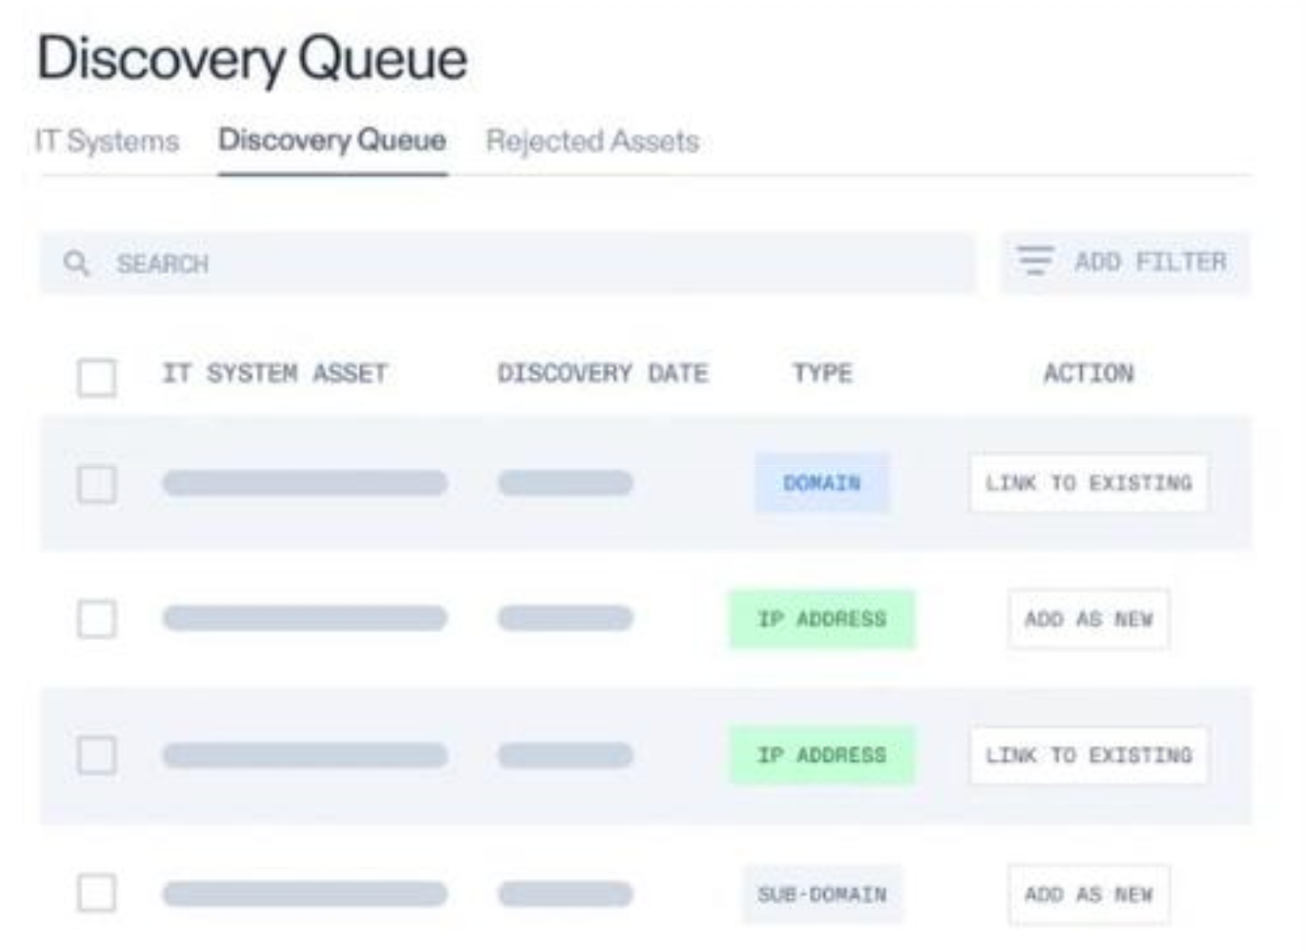
How deep an asset inventory goes is worth weighing directly when comparing IT risk management software.
Inputs come from incident history, control test results, threat intelligence, industry loss data, or calibrated expert estimation. Each carries a different reliability profile, and a reviewer is entitled to know which was used
The assumptions go in writing: the source for each input, the range applied, the confidence attached, and the date. A documented estimate can be challenged, corrected, and rerun, while an undocumented one cannot.
Assumptions have a shelf life, and they need revisiting when the asset, control set, or threat picture changes.
A number that changes nothing is reporting rather than risk management, so the output needs to land in a treatment decision with an owner and a date.
The decision itself is one of five: mitigate, monitor, defer, avoid, or accept. Whichever it is, it has to become a tracked item with an owner rather than a line in a report, and in Optro, high-risk findings become trackable remediation issues.
Programs usually come apart at that last step, when nobody owns the follow-through.
Quantification programs most often come undone on scope: a team commits to modeling the entire risk register, discovers the data is not there, and reverts to the heat map.
The sequence that works runs the other way: narrow scope first, the method proved on one scenario, then widening once the output has changed a decision. Optro's IT & cyber risk management software helps teams "uncover the most critical risks to your organization by quantifying likelihood and potential financial loss."
A first analysis takes one asset from the inventory and one loss scenario attached to it: a customer database and a confidentiality breach, or a payment system and an availability event.
Narrow scope makes the assumptions reviewable, because every input traces back to a specific system rather than an average across the estate. The output expectation is worth setting first: a range with a stated confidence level rather than a point estimate.
Most of what you need sits in systems you already run: incident tickets, vulnerability data, control test results, asset telemetry. Where that data does not cover an input, use calibrated estimation from the people closest to the system, and record it as an estimate.
The sanity check comes next. If the frequency estimate implies an event every three weeks and the service desk has never logged one, the inputs are wrong, and that kind of comparison against lived experience catches errors a more refined model will not.
A board does not need the factor tree. It needs the scenario in one sentence, the loss range, its main drivers, the options, and what each costs. Lead with the decision you are asking for.
The assumptions belong in an appendix, because a numerate director will ask where a number came from, and having the answer earns the method a second hearing.
Use these four indicators to track whether the program is working:
Calibration takes the longest to show anything but tells you the most. A program that reviews last year's estimates against what actually happened gets better at estimating; one that never looks back just gets more confident.
That loop depends on connected risk data and on security, IT, and risk working from the same system of record. A one-off analysis is out of date by the next reporting cycle. A program wired into how risks, controls, and issues are already managed refreshes as that data changes, so the range a board sees reflects the control environment it has now.
Your board wants cyber risk in dollars, not colors on a heat map.
Optro helps you uncover the most critical risks to your organization by quantifying likelihood and potential financial loss, with asset, control, and issue data connected in one system of record.