





GRC
CPE Week | Join us for our second annual CPE Feast, November 30 to December 3 | Register here about this announcement
November 20, 2026 • 14 min read
In The IIA's 2026 North American Pulse of Internal Audit, the share of functions reporting budget increases fell from 34% to 23%, while the share reporting cuts rose from 11% to 19%.
Against that backdrop, an internal audit director or IT compliance manager rarely signs the contract themselves, so the deliverable is a defensible model handed to a CFO, CAE, or CRO. This article supplies the arithmetic: how to price the current state alongside the platform, which benefits survive a finance review, and when each one lands.
ROI on a GRC platform is net benefit over total cost of ownership across a stated horizon. Evaluating platforms and justifying spend are separate exercises: a short list answers which product fits your program, and the business case answers what that product returns in your environment.
Return, payback, and net present value address three different questions. Finance reviewers ask all three because each addresses a different objection: scale, timing, and commitment. Return is a net benefit against total cost across the horizon. Payback is the month when cumulative net benefit crosses zero. Net present value discounts both streams back to today's money.
A published ROI percentage rarely survives the first question a CFO asks about it, which is usually which organization produced the number. Control counts, framework scope, entity count, headcount, and program maturity differ in every direction, so a percentage drawn from someone else's program carries no information about yours.
The horizon and the baseline are both set before any arithmetic. A three-year horizon matches most subscription terms. The baseline is what the current state costs if nothing changes, including the budget pressure The IIA's 2026 Pulse of Internal Audit documents, and benefits are measured against it rather than against zero.
The cost side is where business cases are usually weakest, in two ways: the license line gets treated as the whole number, and the status quo gets treated as free. Pricing the status quo at zero is the more expensive error, because it removes the comparison the case rests on.
The cost base starts with what the vendor invoices. The shape of the subscription matters more than the first-year figure.
The implementation fee quoted in the proposal covers only part of the work. Integration against your identity provider, ticketing system, and ERP sits alongside it, as does migration of control libraries, risk registers, issue logs, and historical evidence.
Internal time belongs in the cost base too. Count the hours your team spends on configuration, data cleanup, user acceptance testing, and training, then cost them at a fully loaded rate. Estimating those hours is easier against a defined rollout sequence, which Optro (formerly AuditBoard) sets out in its GRC implementation guide.
Platform cost has to be compared against what fragmentation already costs you, so price the current state first and let it set the number the platform has to beat.
Price four things:
A connected system of record removes duplicated work rather than making the duplicate pass faster.
Four categories cover most of what a GRC platform returns: reclaimed testing and evidence hours, eliminated duplication across frameworks, probability-weighted avoided cost, and capacity to absorb new scope.
Each needs a named input, a unit, and a place in your own systems where the number lives today. Where a number cannot be pointed to in a system you already run, the benefit is an assertion and will be cut in review.
Hard savings belong on a separate line from avoided cost and capacity, because finance reviewers discount those categories differently.
Input: Controls tested annually, from your control register. Unit: Hours per control test, from timesheets or audit records. Multiply hours saved per test by the annual test count and your fully loaded hourly cost.
Keep the per-test improvement conservative. GRC automation moves this number first, which makes it the easiest to overstate.
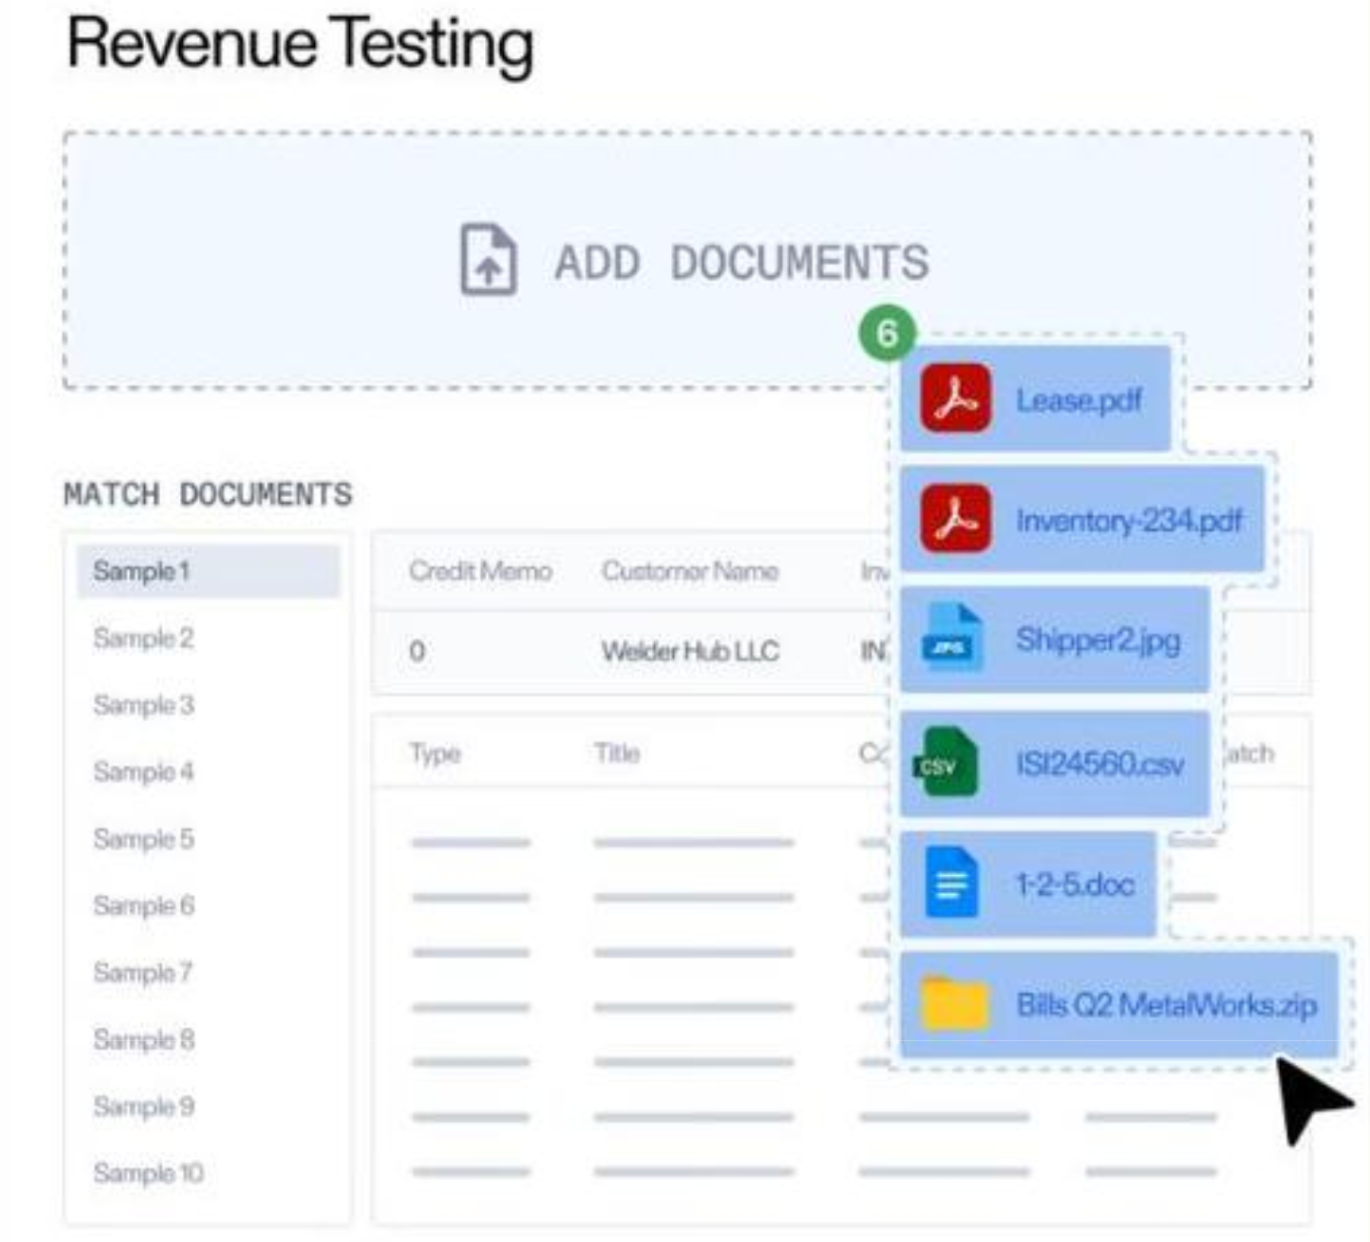
Input: Your control-to-framework mapping. Count controls tested more than once because two frameworks claim them separately. Multiply duplicate tests by current hours per test and the loaded rate.
One test mapped to several framework obligations is a hard saving you can evidence from the mapping itself.
Build this one from your own history, not a published penalty or breach figure. Pull prior-year findings, the remediation hours each consumed, and any late filings or missed deadlines.
Assign a probability and an expected cost to each scenario, and state both openly. A probability-weighted estimate with visible assumptions survives review.
Approving AI tools, assessing AI vendors, and evidencing AI controls arrived as new work without a matching budget line. M&A and international expansion do the same.
Whether that scope needs new headcount depends on how much of it is already mapped. A preloaded framework library turns an added framework into a configuration task rather than a hiring decision, and Optro's GRC Intelligence Platform ships 30+, including SOC 2, ISO 27001, and GDPR. Express the benefit as scope absorbed per existing FTE, and label it capacity rather than cash.
OMB Circular A-94 is the public reference for this method. The circular in force is the October 29, 1992 text, reinstated by OMB Memorandum M-25-23 on April 8, 2025 after a 2023 revision was rescinded.
It treats net present value as the standard test of economic justification, sets a seven percent real discount rate as the base case for benefit-cost analysis, and directs that major assumptions be varied and outcomes recomputed.
Every figure below is a placeholder. Replace each one, and use the discount rate finance accepts.
An input table you can copy into your own business case:
Input | Where to source it | Your value | How it feeds the calculation |
|---|---|---|---|
Controls tested annually | Control register or audit management system | Multiplied by hours saved per test | |
Hours per control test, current | Timesheets or audit workpaper records | Baseline for reclaimed hours | |
Hours per control test, modeled | Vendor estimate, held deliberately conservative | Subtracted from the current baseline | |
Fully loaded hourly cost | Finance, salary plus burden over productive hours | Converts reclaimed hours to currency | |
Frameworks in scope | Current compliance register | Drives duplication and control reuse | |
Duplicate tests across frameworks | Control-to-framework mapping | Hours eliminated by control reuse | |
Prior-year findings and remediation hours | Issue log and remediation records | Basis for probability-weighted avoided cost | |
Subscription and implementation quotes | Vendor proposal | Cost side, split by year | |
Internal rollout hours | Project plan and resource estimates | Year-one cost only | |
Discount rate | Finance, or the 7% real base case | Converts future years to present value |
Vary the two assumptions that move the model most: hours saved per test and year-one adoption ramp.
If the conservative case does not pay back inside the horizon, say so and show which assumption it turns on. Presenting the range with its assumptions is what separates the model from a vendor slide.
Returns land in sequence. Testing and evidence hours move first, usually inside the first full testing cycle after go-live. Duplication savings follow once a second framework maps onto the same control set. Capacity benefits come last.
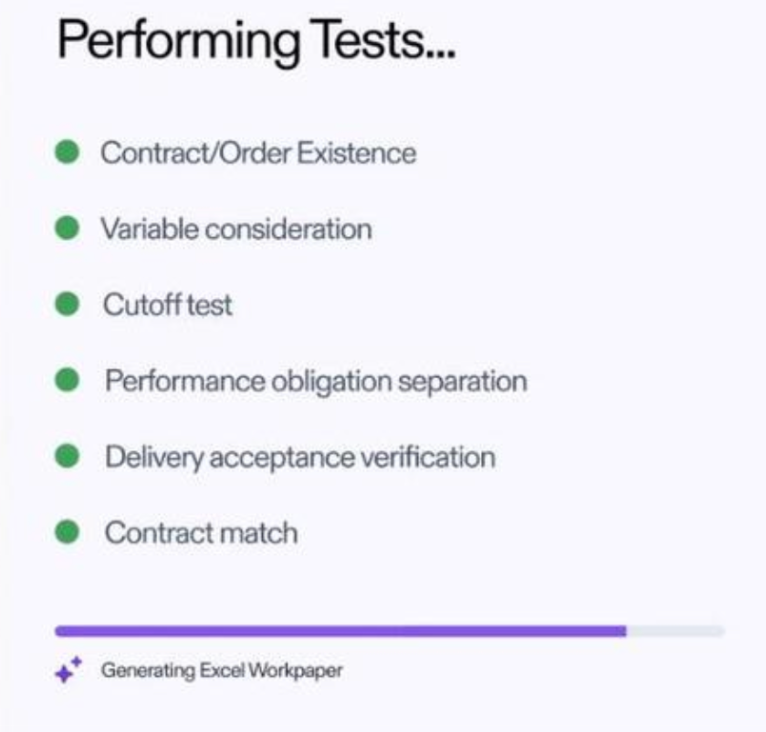
Three things push payback out, and all of them are visible in advance: scope added mid-implementation, data quality work discovered late, and owners who never adopt the workflow.
Baseline four KPIs before go-live: hours per control test, evidence requests per owner, control reuse rate across frameworks, and days to produce board reporting.
The same connected data that produces the savings records the realized return, so reporting it to your sponsor and the board comes from the system rather than a manual rollup.
Your CFO does not need another vendor's ROI percentage; they need yours.
Optro puts audit, risk, and compliance on one system of record, so the hours and control coverage behind your model are visible rather than reconstructed after the fact.